What-If Analysis
Learn how to experiment with data using Excel’s What-If Analysis tools. In this lesson you will use Goal Seek to determine unknown values, explore Scenario Manager, and understand how Data Tables allow you to test multiple possibilities at once.
Video
Watch the lesson video, then complete the reading and challenge.
Lesson Notes
Read through the key concepts before you try the challenge.
Understanding What-If Analysis
What-If Analysis is a powerful Excel feature that allows you to experiment with different values in formulas to see how the results change. Instead of manually changing numbers repeatedly, Excel can automatically calculate the impact of different inputs.
This is extremely useful in business, finance, and data analysis. For example, you may want to know how many units must be sold to reach a target revenue, what grade you need on a final exam to pass a class, or how many guests you can invite to an event while staying within a fixed budget.
Excel provides three primary What-If Analysis tools:
- Goal Seek – finds the required input value needed to reach a desired result.
- Scenario Manager – compares multiple sets of values for different scenarios.
- Data Tables – shows the results of formulas when one or two variables change.
Example: Calculating a Final Grade
In this example, we want to determine the grade needed on a final exam to achieve a passing average in a course.
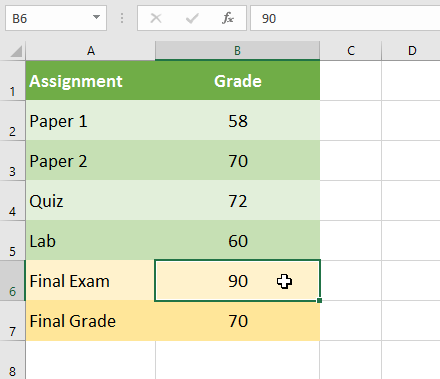
The worksheet contains grades for four assignments: Paper 1, Paper 2, Quiz, and Lab. The final exam grade has not yet been entered, but we already created a formula to calculate the overall average.
The formula used is:
=AVERAGE(B2:B6)
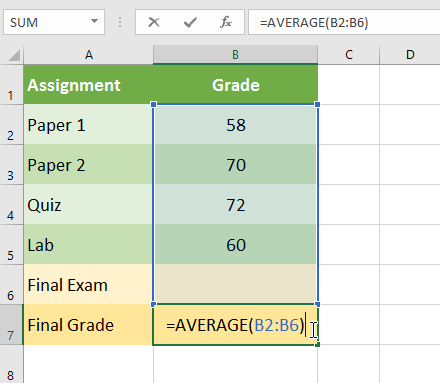
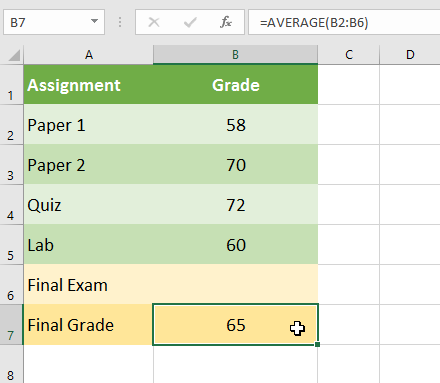
Because the final exam grade has not yet been entered, the calculated final grade currently shows 65.
Opening Goal Seek
Goal Seek allows Excel to calculate what value must be entered into a specific cell in order to produce a desired result.
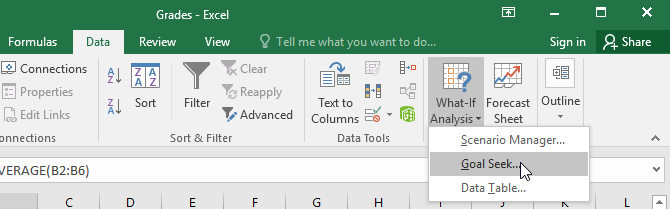
To open Goal Seek:
- Click the Data tab on the Excel ribbon.
- Locate the Forecast or Data Tools section.
- Click What-If Analysis.
- Select Goal Seek from the dropdown menu.

Using the Goal Seek Dialog Box
When Goal Seek opens, a dialog box will appear with three input fields that define the calculation.
- Set Cell – the cell containing the formula result you want to control.
- To Value – the target value you want the formula to equal.
- By Changing Cell – the input value Excel will modify to reach the target.
In our example we want the Final Grade to equal 70.
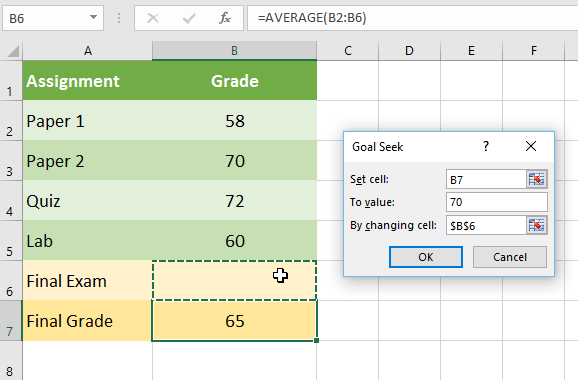
We set the dialog as follows:
- Set cell: B7 (Final Grade)
- To value: 70
- By changing cell: B6 (Final Exam)
Goal Seek Finds the Required Grade
After clicking OK, Excel automatically adjusts the value in the Final Exam cell until the average grade becomes exactly 70.
A confirmation dialog appears indicating that Goal Seek successfully found a solution.
In this case, Excel determines that a score of 90 is required on the final exam in order to reach the target average of 70.
Example 2: Event Budget Planning
Goal Seek can also be used in financial and planning scenarios.
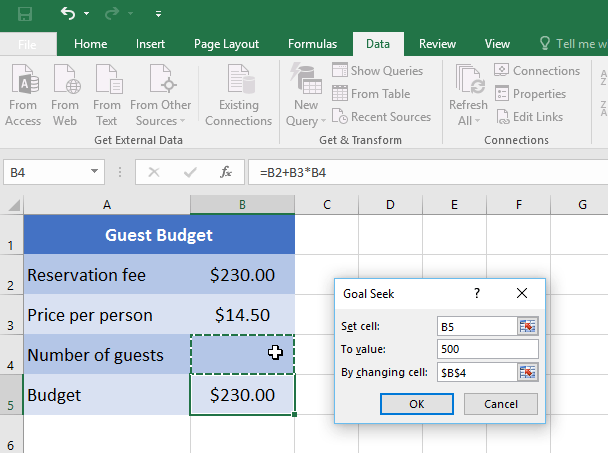
In this example, we are planning an event with a reservation fee and a cost per guest.
The formula used to calculate the total cost is:
=B2 + B3 * B4
This formula adds the fixed reservation fee and the variable cost per guest.
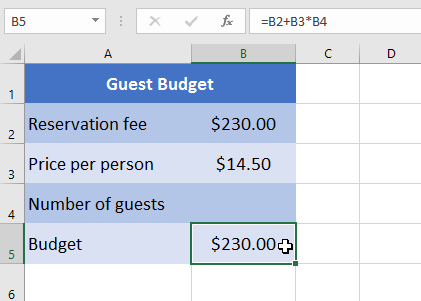
We want to determine how many guests we can invite while keeping the total cost under $500.
Using Goal Seek, we set:
- Set Cell: B5 (Total Budget)
- To Value: 500
- By Changing Cell: B4 (Number of Guests)
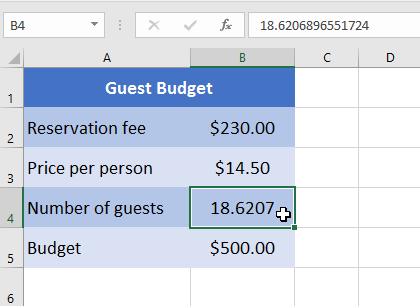
Excel calculates that approximately 18.62 guests can be invited.
Since the number of guests must be a whole number, the value must be rounded down to 18 guests to stay within budget.
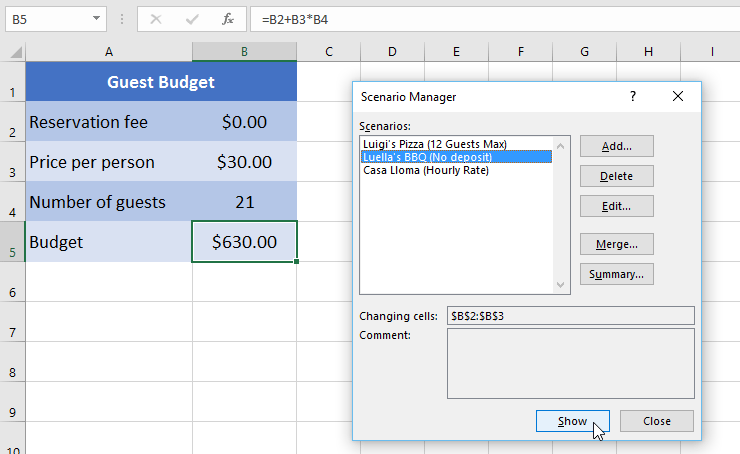
Scenario Manager
Scenario Manager allows you to compare different possible situations by storing multiple sets of values.
For example, you might compare different venues for an event, each with a different reservation fee and price per guest.
Each scenario stores a different combination of input values that can be applied to the worksheet instantly.
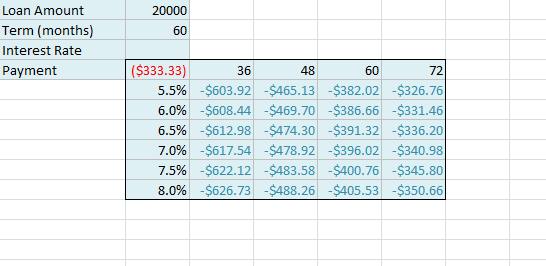
Using Data Tables
Data Tables allow you to evaluate formulas using many different input values at the same time.
In the example below, Excel calculates loan payments for multiple combinations of interest rates and loan terms.
This allows analysts to quickly see how different financial conditions impact the payment amount.
Knowledge Check
Which What-If Analysis tool finds the input value needed to reach a specific result?
Practice File
Download this file and follow along with the lesson.
Challenge
Apply what you've learned in this lesson.
- Download and open the practice workbook.
- Navigate to the Challenge worksheet.
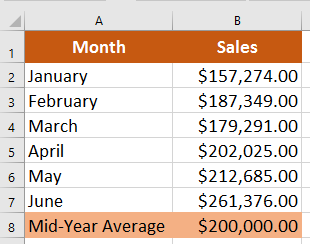
- Create a formula that calculates the average sales for cells B2 through B7.
- Use Goal Seek to determine how much must be sold in June to reach a $200,000 mid-year average.
- Verify that the result updates the average correctly.