Groups and Subtotals
Learn how to organize large datasets using grouping and automatically summarize data with the Subtotal command.
By the end of this lesson you can
- Group rows and columns into collapsible outlines
- Apply automatic subtotals to a sorted data set
- Explain why data must be sorted before subtotalling
- Remove subtotals and return to a clean data range
Video
Watch the lesson video, then complete the reading and challenge.
Lesson Notes
Read through the key concepts before you try the challenge.
Subtotals require a sort first
You summarize spending by category at Lakeside Medical Associates.
You run Data > Subtotal on the supply sheet without sorting it first. Excel inserts a subtotal every time the category changes from one row to the next — producing forty-one subtotals across a sheet with four categories.
Your task: Sort by the grouping column first, so each category occupies one contiguous block.
The Subtotal command inserts a summary row whenever the value in your chosen column changes. It has no memory of categories it has already seen, so if the categories are scattered it dutifully subtotals each run. Sorting by that column first gathers each category into one block, and you get one subtotal per category.
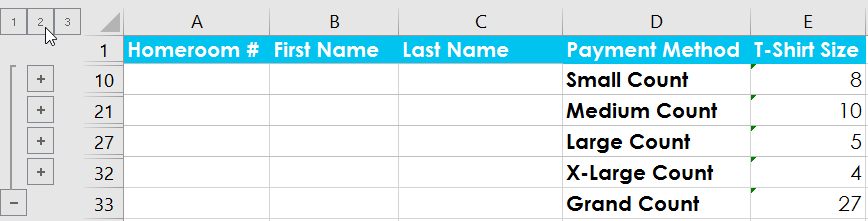
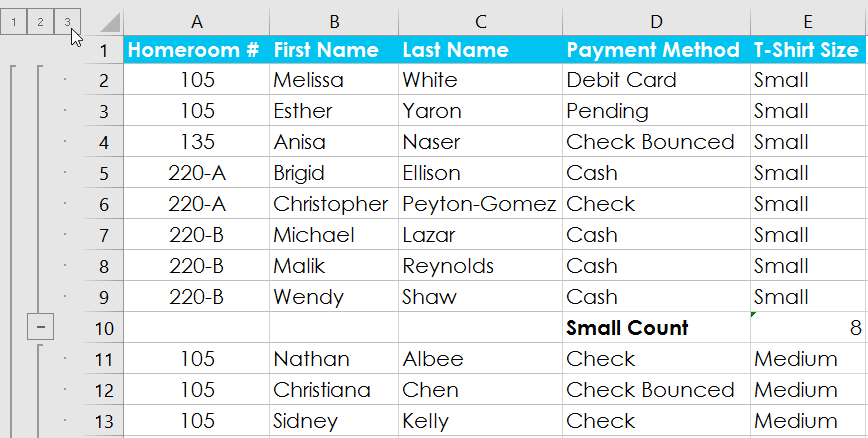
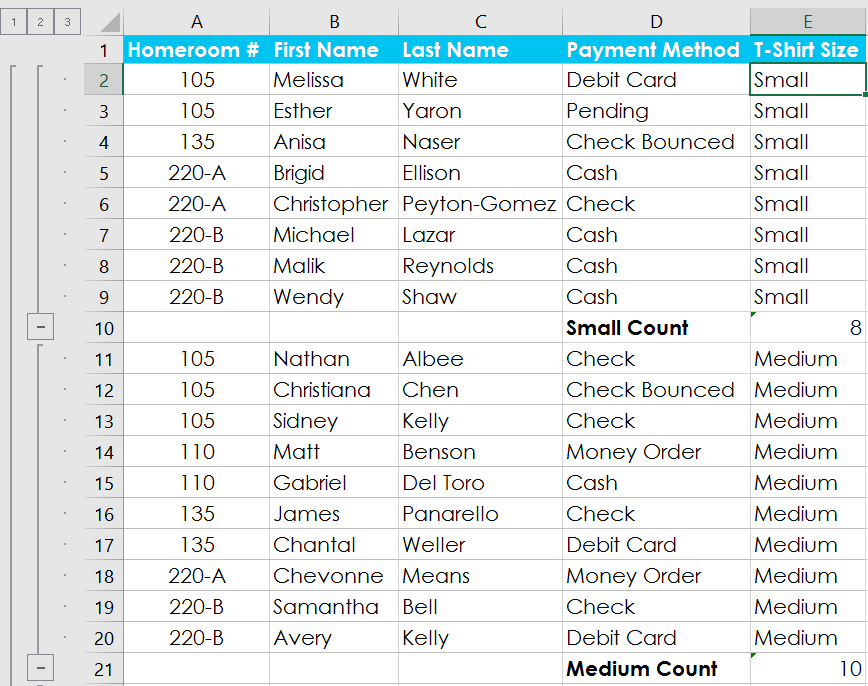
Subtotals add an outline down the left edge with numbered buttons. Clicking 1 shows the grand total alone, 2 shows category subtotals, and 3 shows every row. That collapsibility is the real benefit — the same sheet serves both a manager wanting four numbers and an analyst wanting all 900 rows.
Why Groups and Subtotals Matter
Large datasets can quickly become overwhelming. Groups and Subtotals allow you to organize data into collapsible sections and automatically calculate summaries such as totals, counts, or averages.
When subtotals are applied, Excel creates an outline structure that lets you expand or collapse levels of detail.
Grouping Rows or Columns
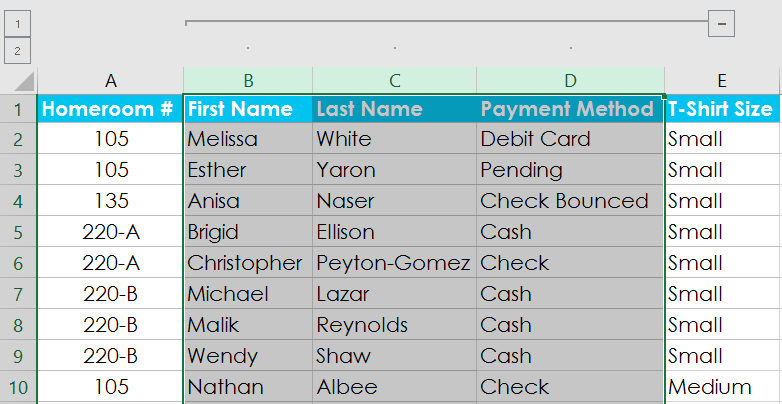
You can manually group selected rows or columns to create collapsible sections.
- Select the rows or columns you want to group.
- Go to the Data tab.
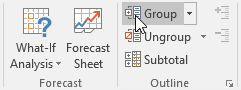
- Click the Group command in the Outline group.
Hide and Show Detail
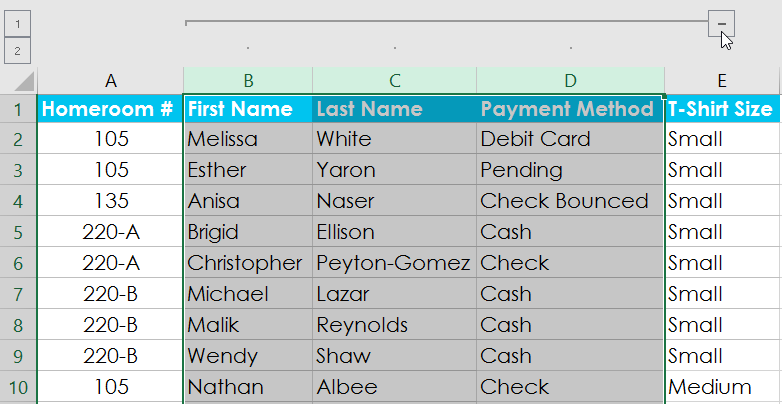
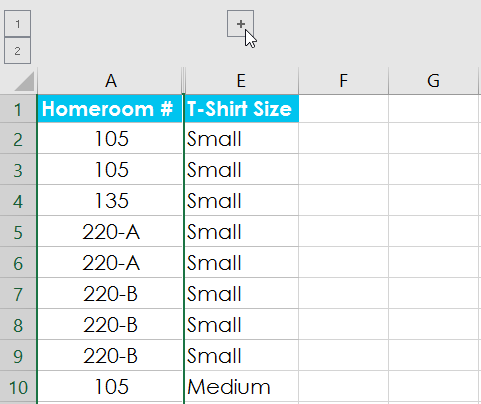
Once data is grouped, minus (-) and plus (+) buttons appear to the left of the worksheet.
Click the minus sign to collapse (hide) detail. Click the plus sign to expand (show) detail.
Important: Sort Before Using Subtotal
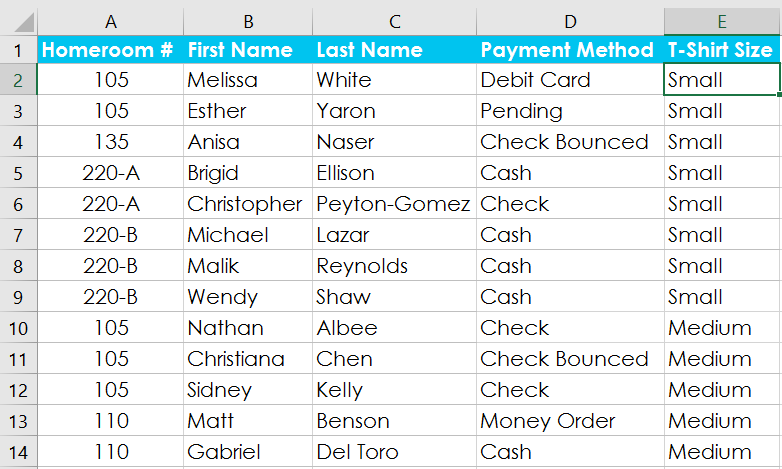
Before creating subtotals, you must sort your data by the column you plan to group by.
For example, if you want to subtotal by T-Shirt Size, sort the worksheet by T-Shirt Size first.
Creating a Subtotal
- Sort your worksheet by the column you want to subtotal.
- Go to the Data tab.
- Click Subtotal.
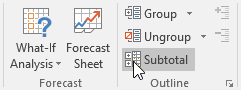
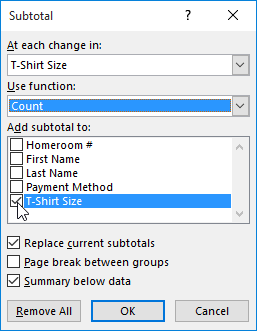
In the Subtotal dialog box:
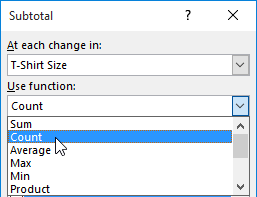
• At each change in: Select the grouping column (e.g., T-Shirt Size) • Use function: Choose COUNT, SUM, AVERAGE, etc. • Add subtotal to: Select the column to calculate
Understanding Outline Levels
After applying subtotals, Excel creates outline levels on the left side of the worksheet.
Level 1 shows only the Grand Total. Level 2 shows subtotal rows. Level 3 shows all detailed data.

Removing Subtotals
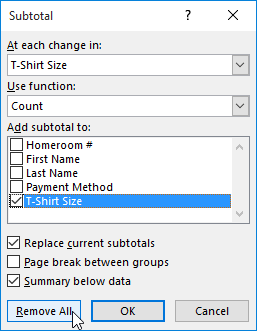
To remove subtotals entirely:
- Go to Data → Subtotal.
- Click Remove All.
Clearing Groups Without Removing Data
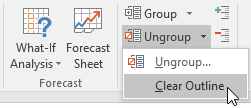
If you want to remove grouping but keep the data, use Clear Outline.
Knowledge Check
What does the Subtotal command do?
Practice File
Download this file and follow along with the lesson.
Challenge
Apply what you've learned in this lesson.
Download the practice workbook and complete the following:
- Click the Challenge tab.
- Sort the worksheet by Grade from Smallest to Largest.
- Use Subtotal to group at each change in Grade.
- Use the SUM function.
- Add subtotals to Amount Raised.
- Select outline Level 2 so only subtotals and the grand total appear.
Finished this lesson?
Progress is saved in this browser only. It is not a grade — official progress lives in Brightspace.