Working with Tables
Learn how to convert datasets into Excel tables, apply styles, add rows automatically, and manage structured data more efficiently.
Video
Watch the lesson video, then complete the reading and challenge.
Lesson Notes
Read through the key concepts before you try the challenge.
Why Tables Matter
Excel tables transform ordinary cell ranges into structured datasets. Once data is converted into a table, Excel automatically enables sorting, filtering, and consistent formatting.
Tables are widely used in financial reports, inventory lists, employee records, and sales tracking because they keep large datasets organized.
Formatting Data as a Table
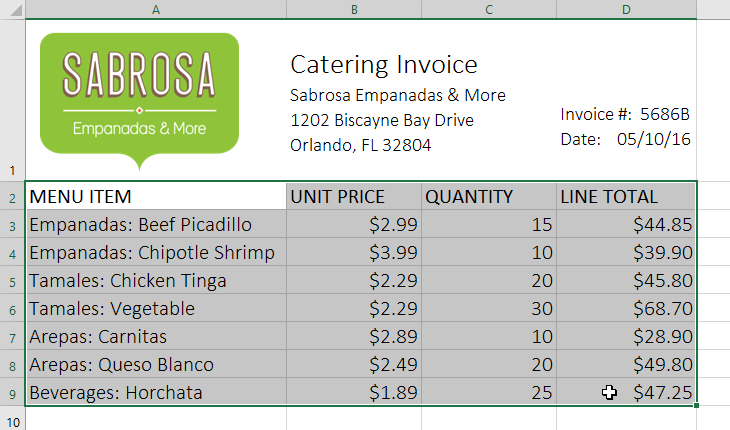
To create a table, first select any cell inside your dataset. Excel will automatically detect the surrounding data range.
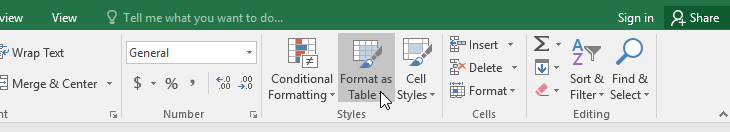
Next, go to the Home tab and click Format as Table.
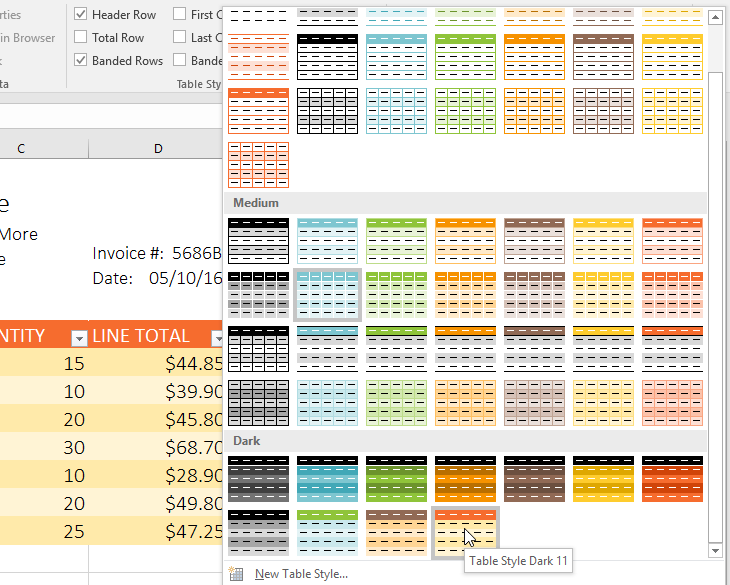
Choose one of the available table styles from the gallery.
Confirm the Table Range
After selecting a table style, Excel displays the Create Table dialog box where you confirm the selected range.
If your dataset contains column headers, make sure the My Table Has Headers option is checked.
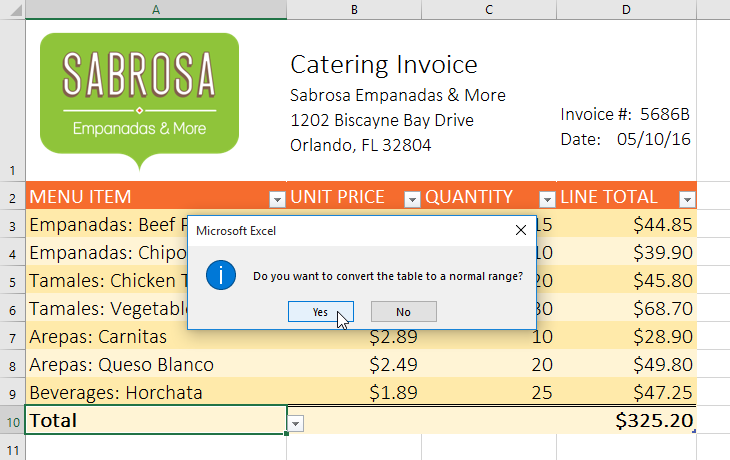
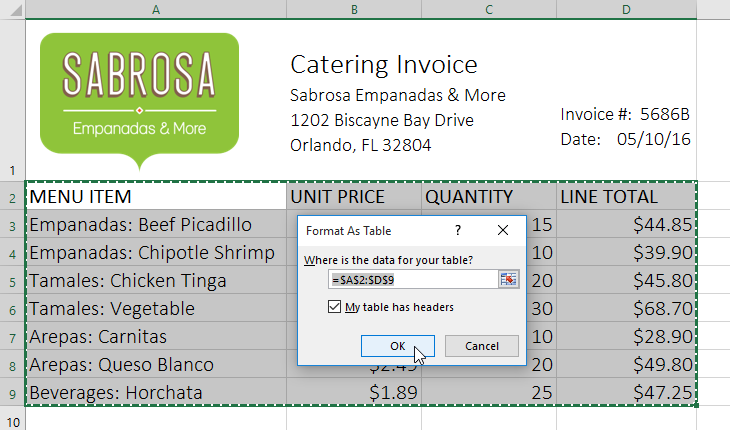
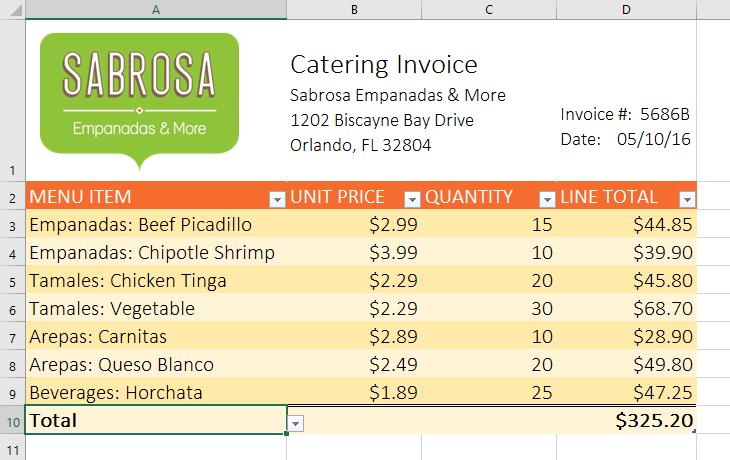
Table Style Applied
After confirming the dialog box, Excel converts the dataset into a formatted table.
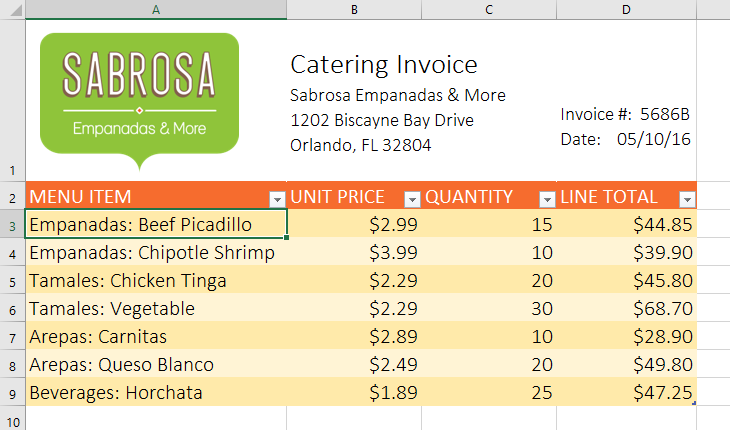
Table styles include alternating row colors, filter dropdowns, and consistent formatting across the dataset.
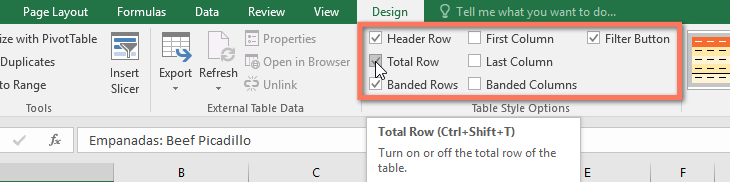
Using the Table Design Tab
Once a table is created, Excel adds a Table Design tab to the ribbon. This tab contains tools for customizing the table.
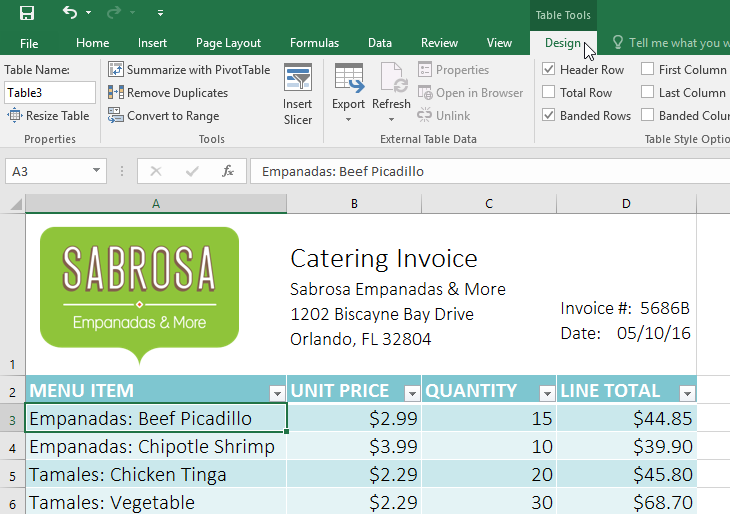
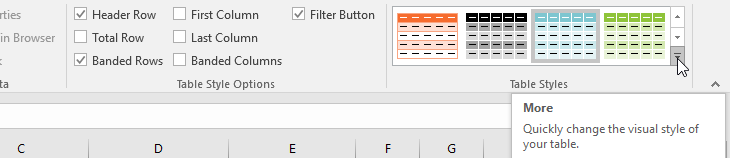
You can use the Table Styles section to quickly apply a new visual style.
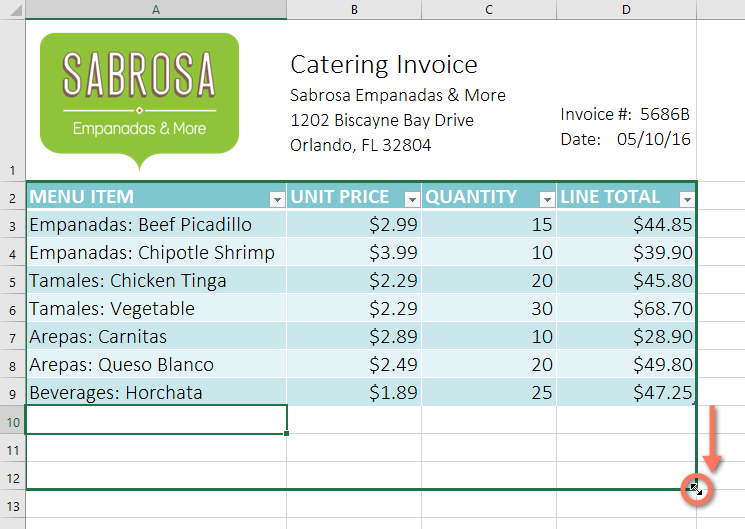
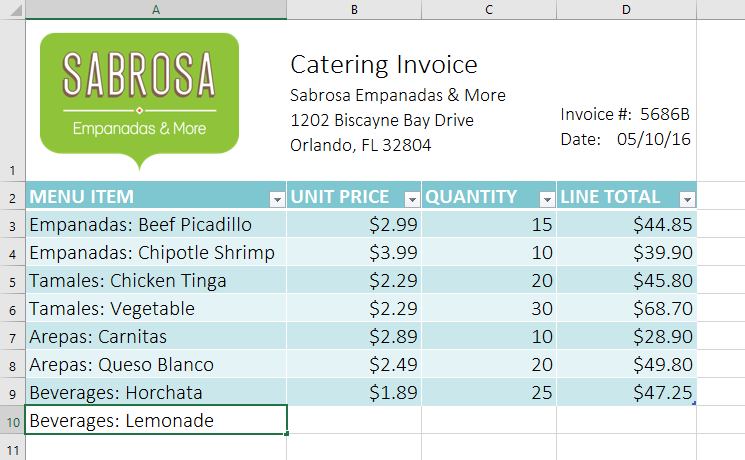
Adding New Rows
One powerful feature of Excel tables is automatic expansion. When you add new rows directly below the table, Excel automatically includes them in the table structure.
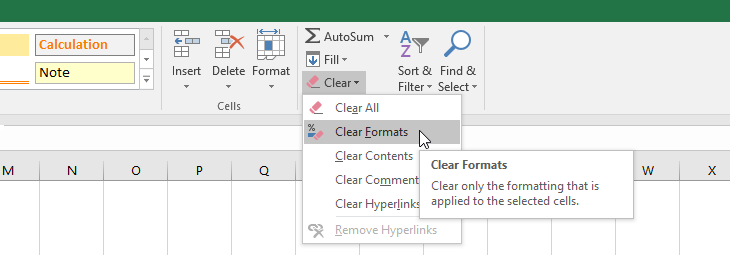
Deleting Rows from a Table
Rows inside a table can be deleted just like normal rows. Excel automatically adjusts the table size after deletion.
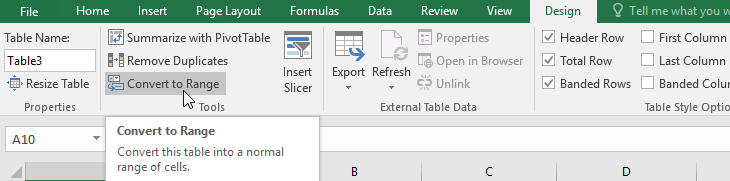
Convert Table Back to a Range
If you no longer need table functionality, you can convert the table back to a standard cell range.
Knowledge Check
What is one advantage of converting a data range to an Excel Table?
Practice File
Download this file and follow along with the lesson.
Challenge
Apply what you've learned in this lesson.
Download the practice workbook and complete the following steps:
- Open the Challenge worksheet.
- Select the entire dataset.
- Format the data as a table using a Medium style.
- Add a new row at the bottom of the table.
- Enter sample data for the new row.
- Delete one row from the table.
- Change the table style using the Table Design tab.
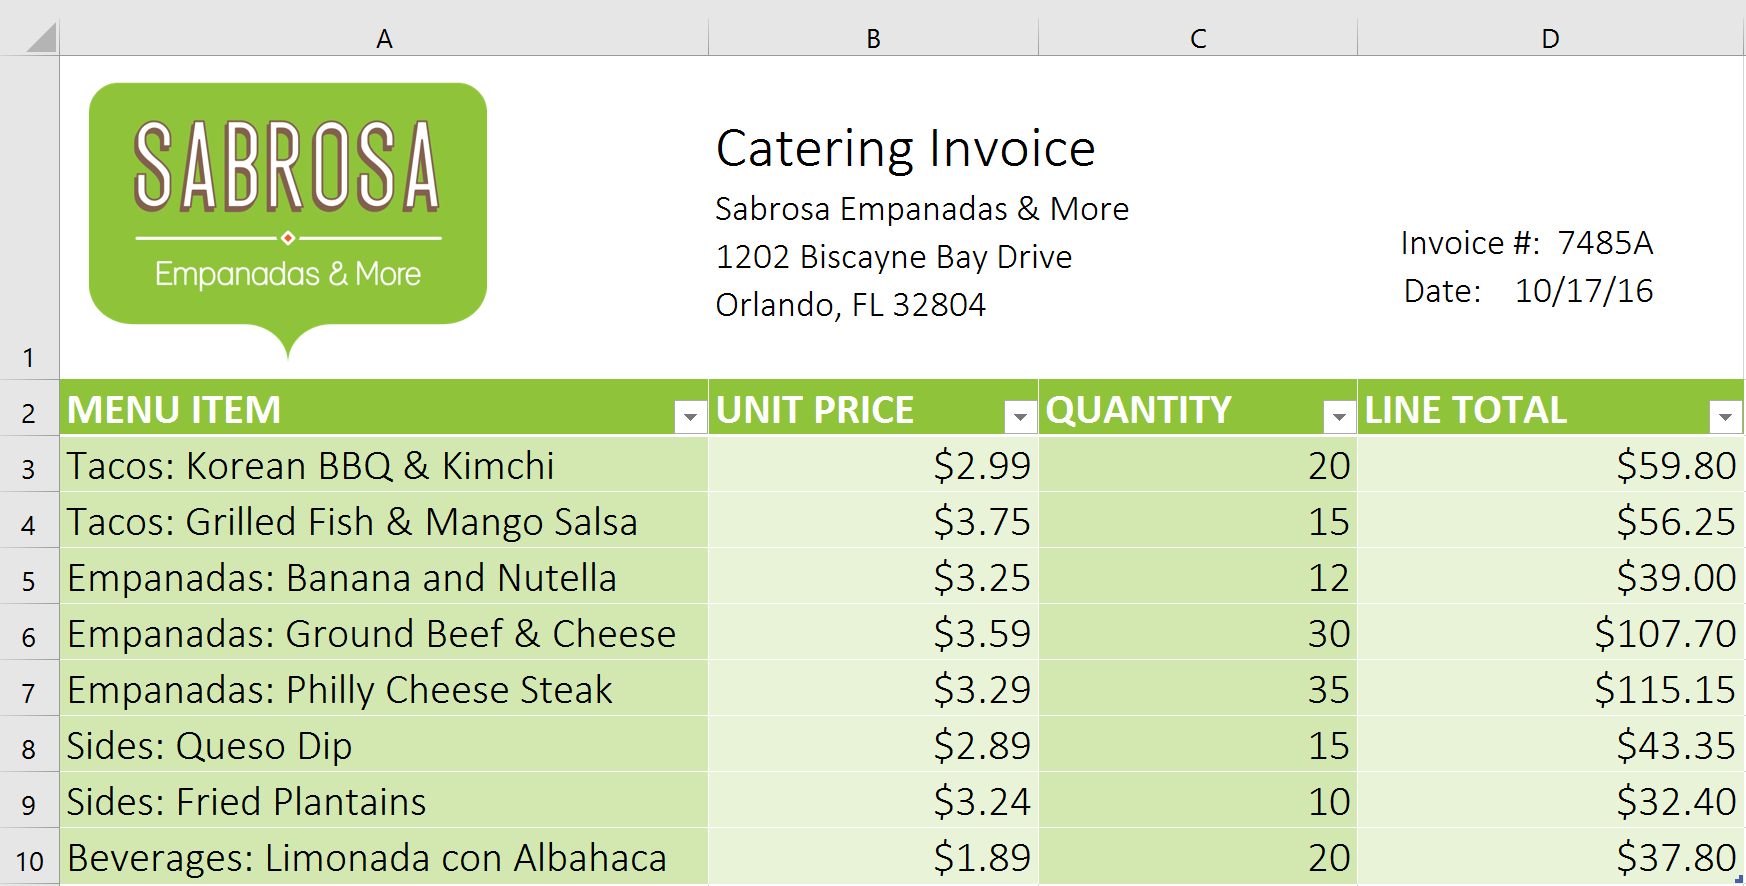
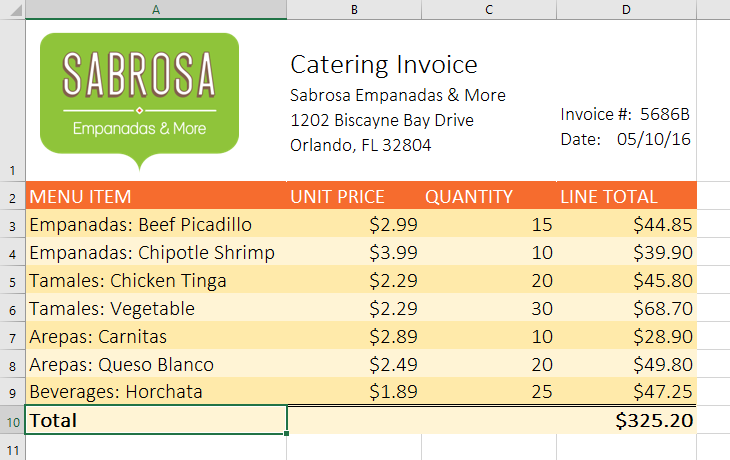
- When finished, your table should look similar to the example below.